ТОР 5 статей:
Методические подходы к анализу финансового состояния предприятия
Проблема периодизации русской литературы ХХ века. Краткая характеристика второй половины ХХ века
Характеристика шлифовальных кругов и ее маркировка
Служебные части речи. Предлог. Союз. Частицы
КАТЕГОРИИ:
- Археология
- Архитектура
- Астрономия
- Аудит
- Биология
- Ботаника
- Бухгалтерский учёт
- Войное дело
- Генетика
- География
- Геология
- Дизайн
- Искусство
- История
- Кино
- Кулинария
- Культура
- Литература
- Математика
- Медицина
- Металлургия
- Мифология
- Музыка
- Психология
- Религия
- Спорт
- Строительство
- Техника
- Транспорт
- Туризм
- Усадьба
- Физика
- Фотография
- Химия
- Экология
- Электричество
- Электроника
- Энергетика
Presenting Information Using Charts and Graphs
The comment on the visual includes the following stages:
● Introducing the visual and its meaning
● Drawing attention to most important points
● Giving explanations.
1. Listen or / and read this description and find phrases performing these three functions.
| TAN: JOHN: TAN: DENISE: TAN: JOHN: TAN: TAN: DENISE: | Now, I'd like to refer to the first graph – as you can see this is a bar graph measuring net sales over the first ten months of the year. You'll notice that sales rose steadily in the first few months, then there was a marked increase in April. They peaked in May at around 3.2 million, and levelled off, then there was a dramatic drop in the following month, followed by a significant increase in August, and this trend has continued up until the present. What was the reason for the sudden drop in July? This was mainly due to a drop off in air conditioner sales – so it's a seasonal effect. Could it be a consequence of the negative effect of the interest rate rise? Possibly. Now, if I could draw your attention to this next diagram. This is a line graph of sales – the blue line represents air conditioner sales, the red line shows heaters. As you'll note, air conditioner sales dropped steadily from January to July, bottoming out then, while heater sales experienced a sharp increase from March to June, then dropped markedly from June to July, then declined through to September, with a pronounced drop in October. Does this explain the fluctuation in total sales? Largely – if we look at this pie diagram, you can see that air conditioners and heaters together represent more than half of our total sales - but they vary seasonally, while other appliances are fairly steady through the year. Well, we can't sell air conditioners when it's cold. What's the solution? Export to Europe and America! Easier said than done. |
2. Fill in the blanks with the words from the box. Listen and check.
slump deterioration recovered low point
Sam: The next slide we are going to look at shows the fluctuation of sales over the past two years.
Karen: Wow! Last quarter we hit quite a _____!
Sam: Yes, we did. And we can see in this graph that sales started to gradually worsen in the last quarter of the last year. They _____ slightly in the first quarter, but then continued to fall until the present quarter.
Mike: Any idea what caused this _____ in sales?
Sam: One significant factor is the economy. We’ve not the only ones facing this problem. But the good news is that I think we’ve reached a _____ and things are going to improve in the next quarter.
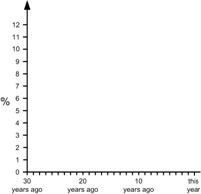
3. Complete the graph and the pie charts using the information below.
The growth rate in N… was around four per cent a year for ten years. A period of very fast growth followed, with the growth rate reaching 12 per cent ten years later. Growth was nine per cent in the following three years, but fell to two per cent in the year after that. It then increased steadily to reach five per cent two years ago, and has stayed at the same level.
30 years ago, GDP in N… came 70 per cent from agriculture, 20 per cent from industry and 10 per cent from services. At that time, GDP was US$10,000, coming 50 per cent from industry, 40 per cent from services and 10 per cent from agriculture.
Today, GDP per person is US$10,000m, coming 50 per cent from industry, 40 per cent from services and 10 per cent from agriculture.
| 
| 
|
N… GDP 30 years ago N… GDP this year
LISTENING
1. Listen to the excerpt of the lecture and take notes, focus on the definitions given by the lecturer.
2. Using your notes complete the following statements.
1) The subject of the lecture is
a. income statement
b. balance sheet
c. cash flow
2) Assets are
a. what a company owns
b. what a company owes
c. what a company earns
3) Net worth is
a. what a company owns
b. an excess of company’s assets over its liabilities
c. all company’s assets
4) Goodwill is
a. company’s reputation,
b. company’s debts
c. company’s good prospects for future growth
5) A take-over bid is
a. an offer to buy a company
b. an offer to sell a company
c. an offer to insure a company
3. Listen to the lecture again, look at the figure below; complete your notes.
Не нашли, что искали? Воспользуйтесь поиском: